Case Study
Project ABA
- Stalin Sunny -
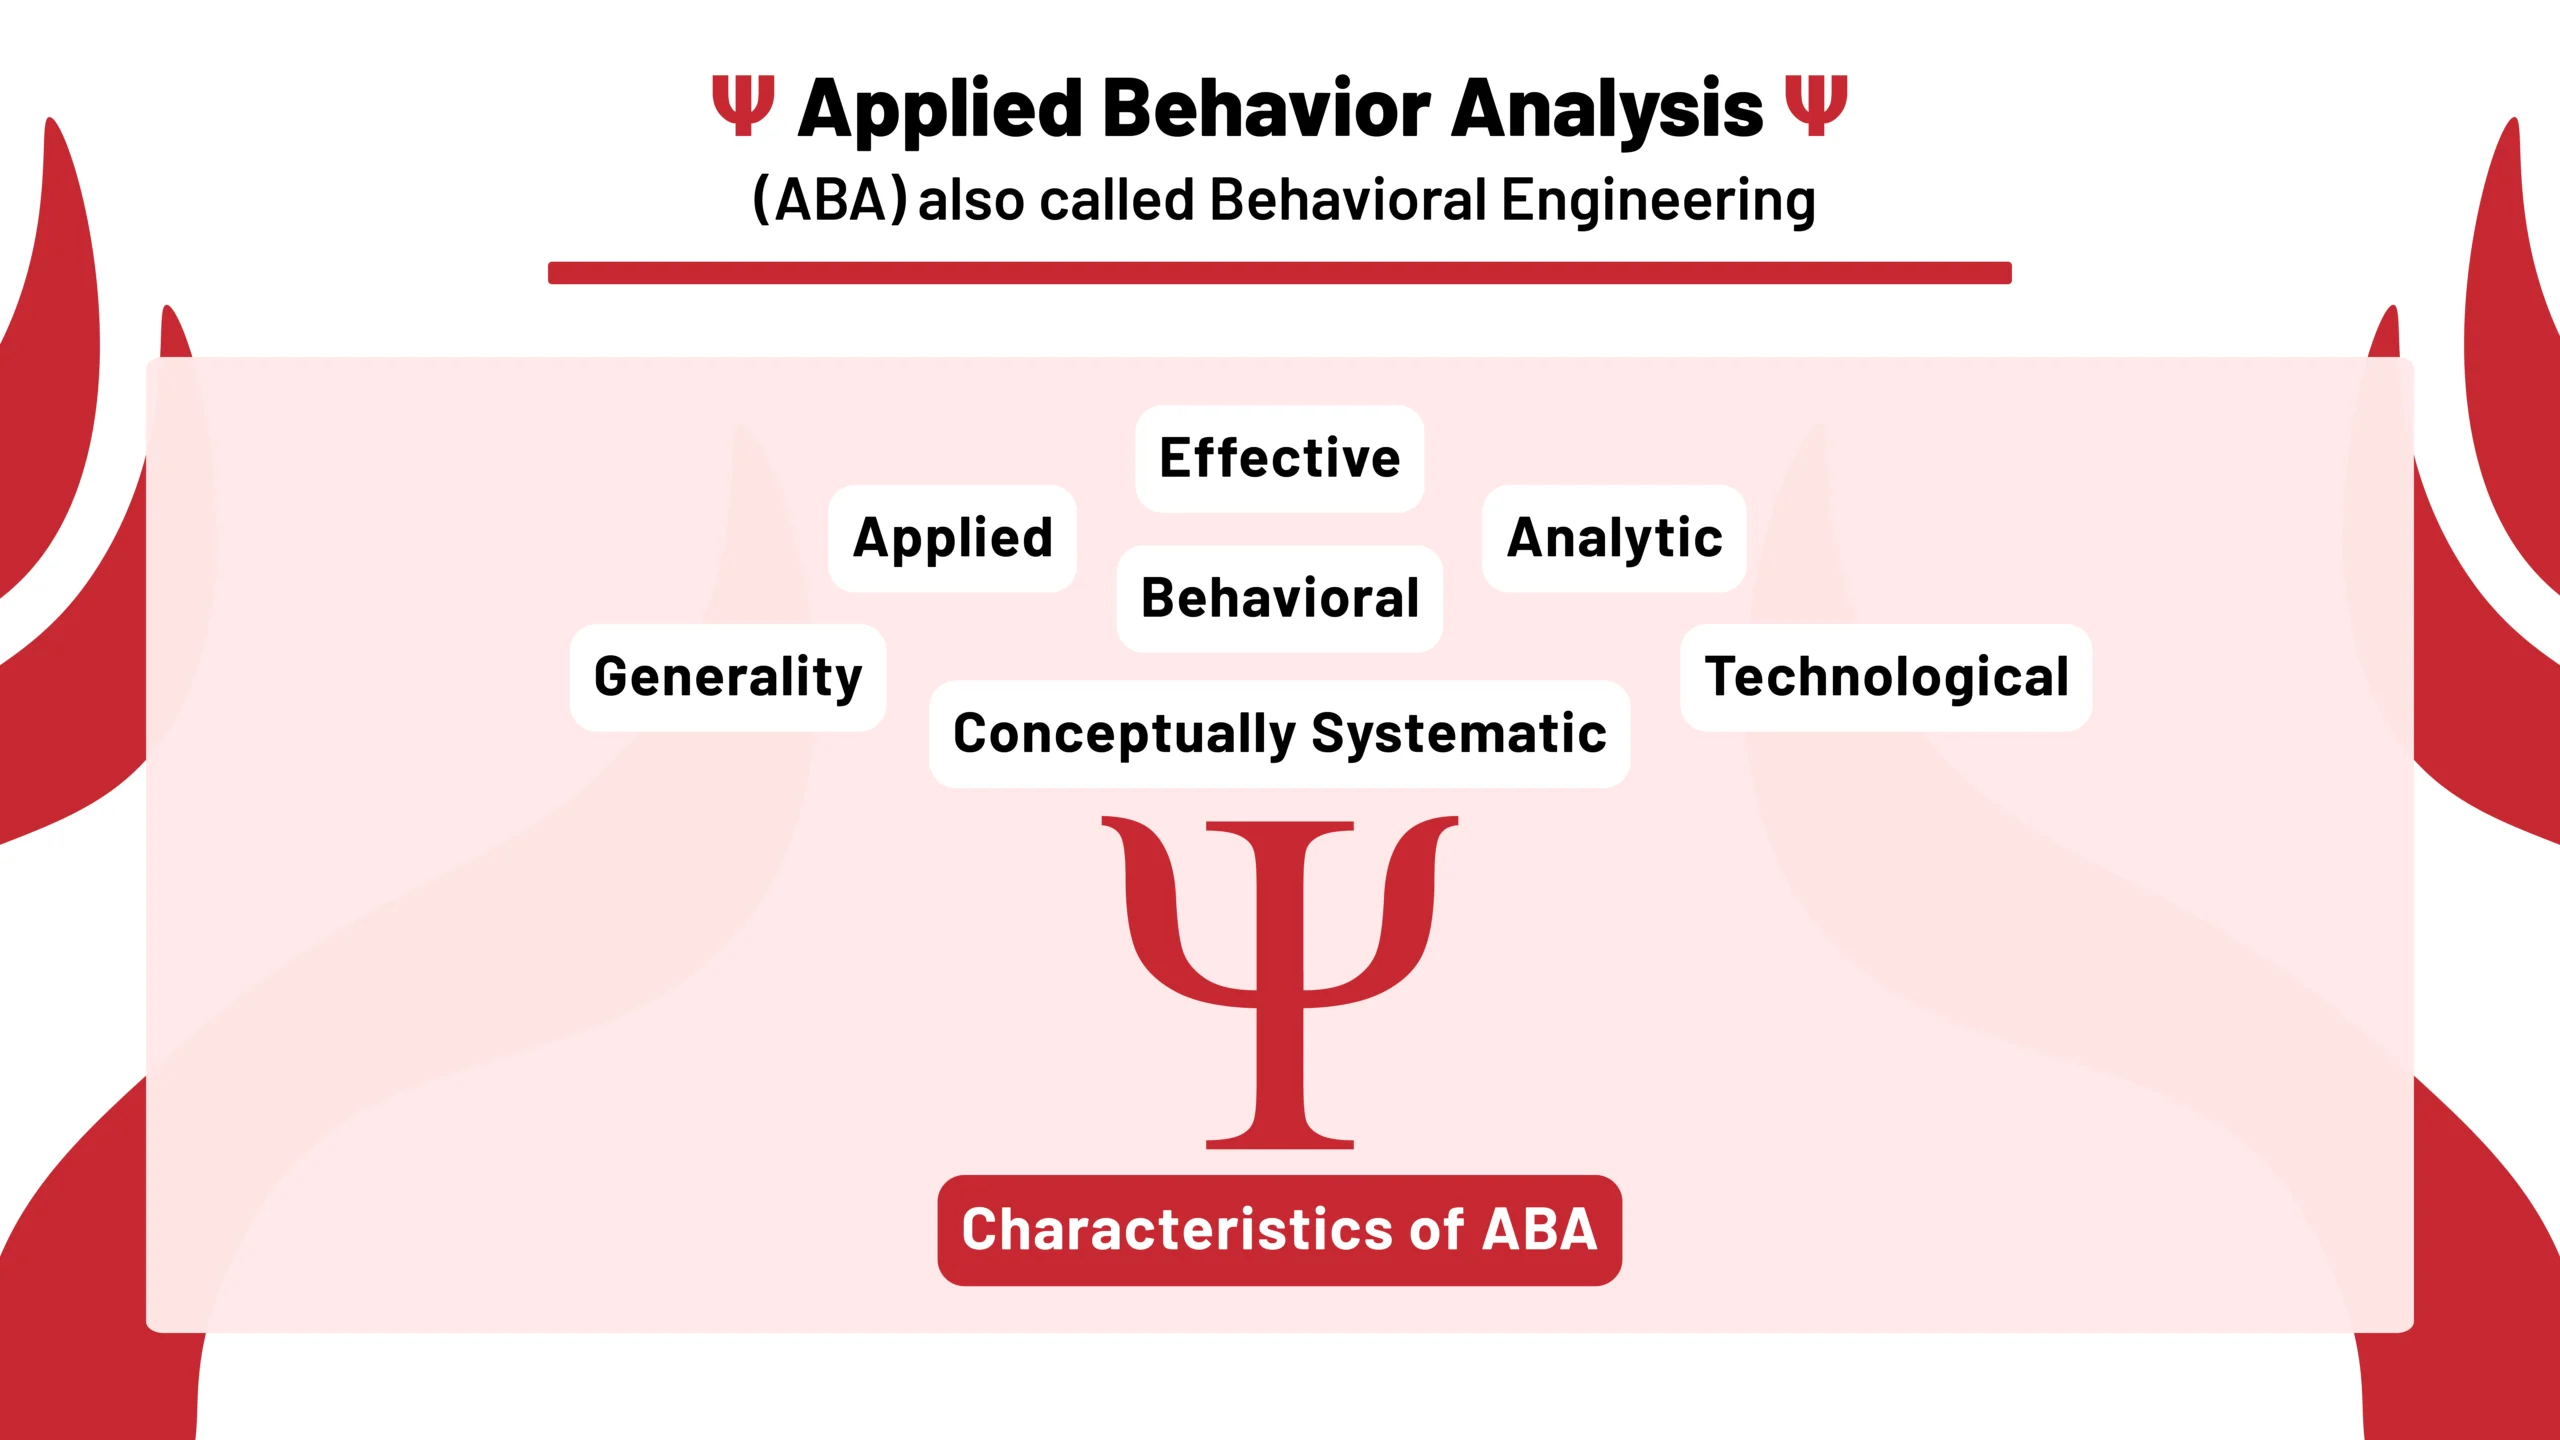
Applied Behavior Analysis (ABA)
What is ABA?
ABA is also called Behavioral Engineering
ABA is a way to help people learn new skills and improve behaviors by understanding how they react to things around them. We can think of ABA as using rewards and practice to make good habits stronger and bad habits happen less often. It’s like training for your brain to get better at things like talking, listening, or staying calm. ABA is often used to help kids and adults in schools, at home, or in everyday life.

ABA
ABA's application is varied.
ABA principles are used to train everything from dogs to dolphins to improve their behavior!
How?
ABA uses learning principles (like rewards) to increase good behaviors and decrease bad ones. ABA aims to improve socially significant behaviors using evidence-based methods.
Where ?
ABA is commonly used to help individuals with autism but can be applied in schools, healthcare, workplaces, etc.
Objectives of ABA:
ABA helps individuals develop useful skills and improve their quality of life.
ABA focuses on how the environment affects behavior. ABA emphasizes individualized treatment and data tracking.
- Improving social skills
- Enhancing communication
- Increasing independence
- Reducing harmful behaviors
- Applying learned skills in different settings.
Characteristics of ABA:
ABA employs systematic, data-driven reinforcement to shape targeted behaviors.

Effective
ABA interventions produce meaningful and positive changes in behavior.
Applied
ABA focuses on behaviors that are socially significant and improve the quality of life for individuals (e.g., communication skills or social interactions).
Analytic
ABA relies on data to demonstrate a clear relationship between interventions and behavioral outcomes.
Behavioral
ABA emphasizes observable and measurable behaviors, ensuring that progress can be objectively tracked.
Generality
The learned behaviors should last over time, occur in different settings, and spread to other related behaviors.
Conceptually Systematic
Interventions are based on established principles of behavior, ensuring a strong theoretical foundation.
Technological
Procedures are described in detail so that they can be replicated by others with consistency.
Introduction
01. Project ABA - Case Study
Background
ABA is complex and involves many interconnected concepts, making it challenging to represent visually. This case study documents the process of designing a diagram to effectively communicate the core principles of ABA.
Problem Statement
Traditional ABA explanations often use text-heavy descriptions, making them challenging for some learners to comprehend.
Why?
A clear, concise, and visually engaging representation of ABA principles was needed to enhance understanding and communication.
Goal
The goal of this project was to design a diagram that accurately and effectively visualizes the key dimensions or principles of ABA and to promote public awareness of the same.

Methodology
02. Project ABA - Case Study
Considerations:
Design Considerations and Audience Insights
Visual Hierarchy
Clarity
Simplicity
Accessibility
Research and Analysis:
- The design process began with a thorough review of ABA literature, focusing on key concepts, dimensions, and principles.
- Existing visualizations of ABA concepts were analyzed to identify strengths and weaknesses.
- Target audience was considered.
Target audience:
- Students of Behavior Analysis
- Practicing Behavior Analysts
- Educators and Special Education Professionals
- Parents and Families
- Individuals with Diverse Learning Styles
- Related Professionals
Persona:
A representation of a target user, created based on research and data.
Name:
Alvin Rosario
Age:
Occupation:
Personality:
Background:
He is a recent graduate with a Bachelor’s degree in psychology, eager to apply his knowledge of Applied Behavior Analysis (ABA) to help children. He is passionate about the field and committed to providing effective interventions. However, he is a strong visual learner, relying heavily on diagrams, charts, and flowcharts to understand complex concepts.
Scenario:
Goal:
Technology Proficiency:
Pain Points:
He finds it challenging to understand abstract ABA concepts, such as functional assessments and reinforcement schedules, when explained through text or verbal descriptions alone.
He struggles to visualize the relationships between variables and the steps involved in various procedures.
While he understands the importance of data collection, he faces difficulty interpreting complex data sets without visual aids like graphs or charts.
The lack of visual tools makes it harder for him to identify patterns and develop effective intervention strategies.
He spends excessive time creating his own diagrams, leading to frustration and inefficient learning.
Without visual resources, he feels underprepared and less confident in applying ABA principles, especially with challenging behaviors.
His incomplete understanding of some concepts results in occasional inconsistencies in applying ABA principles.
Alvin Rosario: The Visual Learner's Struggle with Text-Heavy ABA

Quote:
"I understand the words, but I can't picture it in my head. If I could just see a diagram or a flowchart, it would make so much more sense."
Impact:
Alvin's struggle with the lack of visual aids hinders his learning and potentially affects his ability to provide effective ABA interventions. This challenge could lead to reduced job satisfaction and slower progress in advancing his career.

Crafting the Diagram from Concept to Clarity
Iterative Design Process:
Brainstorming
Generating initial ideas and concepts.
Sketching
Creating rough drafts of the diagram.
Prototyping
Developing digital versions of the diagram.
Feedback
Gathering feedback from experts and target users.
Refinement
Revising the diagram based on feedback.
Tools Used:

Adobe ® Illustrator
For Main Work

Adobe ® Photoshop
For Editing

Microsoft ® Word
For Text

Microsoft ® PowerPoint
For Presenting

Adobe ® PS Express
For Image Edits

Adobe ® Acrobat Scan
For Scanning
Diagram Development:
One of the earliest recorded diagrams is from Euclid's "Elements" around 300 BCE
Theme:
The design theme of this diagram is modern and professional, characterized by a bold use of Persian Red that anchors the visual identity. The layout is clean and organized, employing minimalist elements such as clear typography and neatly arranged text boxes that emphasize key ABA principles. This structure creates a harmonious balance between aesthetic appeal and informational clarity, reinforcing the systematic, analytical nature of Applied Behavior Analysis. Overall, the theme is designed to make complex concepts accessible and engaging through a visually precise and refined approach.
Highlights:
The Psi symbol was chosen as a central visual element to connect the diagram to the field of psychology and behavior analysis. The elements are arranged in a shape of a tree for easy recall. A limited color palette was used to enhance clarity and avoid visual clutter.
Colors:
Persian red
#C42C35
White
#FFFFFF
Eerie black
#191919
Lavender blush
#FBEAEA
Typeface:
Barlow
The font used for ABA, Barlow, is a slightly rounded, low-contrast, grotesk typeface that captures the essence of California’s public visual style. It reflects design elements seen in car plates, highway signs, buses, and trains, offering a clean yet distinctive appearance. Barlow belongs to a versatile superfamily that includes Normal, Semi Condensed, and Condensed styles, each available in nine weights with Roman and Italic variations. Created by San Francisco-based designer Jeremy Tribby, this typeface strikes a balance between readability and personality, making it a fitting choice for professional and approachable communication.

Observation
03. Project ABA - Case Study
Discussions:
Design Thoughts and Feedback
Surveys:
A survey was administered to 5 participants (including psychology students, professionals, and parents) at two stages: after reviewing initial sketches and after reviewing the final diagram. Surveys included verbal questions assessing clarity, understanding, engagement, and perceived effectiveness of the visualization.
Quantitative data revealed a 52% increase in positive responses regarding the clarity of the diagram from the initial sketches to the final version, achieving an overall clarity rating of 87%.
Survey Questions:
Q1. Understanding Visual Learning:
"How do you approach learning complex ABA concepts, and why are visual aids (such as diagrams, charts, or flowcharts) crucial for your comprehension?"
Q2. Challenges with Text-Heavy Material:
"Can you describe a specific instance where reading dense, text-only material about functional behavior assessments left you feeling frustrated or overwhelmed?"
Q3. Self-Created Visual Aids:
"What types of diagrams or visual representations have you created on your own to help understand ABA procedures, and what challenges do you face when developing these visuals?"
Q4. Impact on Professional Confidence:
"In what ways has the lack of visual resources affected your confidence or consistency in applying ABA principles and interventions in your work with children with ASD?"
Q5. Suggestions for Improvement:
"Based on your experience, what kind of visual tools or enhancements would most improve how ABA concepts—especially functional behavior assessments—are taught and understood in your setting?"
Feedback Questions:
Q1. Clarity Improvement:
"What specific improvements in the final diagram do you believe contributed most to the increase in clarity compared to the initial sketches?"
Q2. Engagement and Understanding:
"How did your level of engagement and overall understanding change when reviewing the final diagram versus the initial sketches?"
Q3. Effectiveness of Visual Elements:
"Can you identify any particular visual element in the final version that significantly aided your comprehension of ABA concepts?"
Q4. Impact on Learning:
"In what ways do you think the enhanced diagram might influence your approach to applying or teaching ABA principles?"
Q5. Suggestions for Further Refinement:
"Based on your experience, what additional changes or improvements would you recommend to make the visualization even more effective?"
Feedback:
Interviewees consistently praised the diagram’s representation of the seven dimensions of ABA in a tree like shape, noting its “comprehensive but concise” nature.

Comparative Analysis:
Analysis of Pre-existing Diagrams:
The analysis revealed that the designed diagram offered a more integrated and visually cohesive representation of the seven dimensions, while many existing visuals presented the dimensions in a fragmented or text-heavy manner.

Usability Testing:
Functionality Review:
Participants were given tasks such as identifying specific dimensions, explaining their relationships, and recalling key concepts. Some users reported that individual icons for dimensions maybe useful.
Usability testing was conducted with 7 participants to assess the ease of use and navigation of the diagram (particularly in a digital format).
Key Insights and Patterns
Effective visual communication, through clear hierarchy, simplicity, iteration, and metaphors, enhances learning and recall.
The Power of Visual Hierarchy:
- A clear visual hierarchy was crucial for guiding users through the information and emphasizing key concepts.
- The use of font size, weight, and color, along with strategic placement of elements, significantly impacted the user’s ability to understand the diagram’s message.
- For example, the prominence of the Psi symbol and the bold main title effectively drew the user’s attention to the central concept of ABA.
The Importance of Simplicity:
- Simplicity was a key factor in the diagram’s effectiveness.
- Avoiding overly complex graphics and using clear, concise language made the diagram more accessible to a wider range of users.
- The focus on the seven dimensions, represented by simple shapes, allowed users to quickly grasp the core components of ABA.
The Effectiveness of Iterative Design:
- The iterative design process, involving feedback and refinement, was essential for creating a high-quality diagram.
- Feedback from users and experts led to significant improvements in the diagram’s clarity, accuracy, and visual appeal.
- The willingness to revise and adapt the design based on feedback was crucial for achieving the project’s goals.
The Value of Visual Metaphors:
- Visual metaphors, such as the cyclical flow, were effective in communicating abstract concepts.
- The cyclical representation of ABA emphasized its iterative nature and ongoing process of assessment, intervention, and evaluation.
- The use of the Psi symbol effectively connected the diagram to the field of psychology and behavior analysis, providing a familiar and recognizable visual anchor.
Enhanced Engagement and Recall:
- The visual nature of the diagram significantly enhanced user engagement and recall compared to text-based descriptions of ABA.
- Participants reported finding the diagram to be more engaging and memorable, suggesting its potential as a valuable learning tool.
Diagram:
Achievements and Results
04. Project ABA - Case Study
Results and Outcomes:
Clear and Concise Visual Representation:
The diagram successfully distilled the complex concept of Applied Behavior Analysis (ABA) into a visually accessible format. It effectively highlighted the seven key characteristics of ABA (Applied, Behavioral, Analytic, Technological, Conceptually Systematic, Effective, and Generality) in a structured and easily digestible manner.
Enhanced Understanding of ABA:
The diagram served as a valuable tool for understanding the core principles of ABA. The use of individual boxes for each characteristic, arranged around the central symbol of psychology (Psi), provided a clear and organized presentation of the information.
Improved Communication and Education:
The diagram proved useful for communicating the fundamental aspects of ABA to a wider audience, including students, professionals, and individuals seeking information about the field. It facilitated a more engaging and effective learning experience.
Positive Feedback and Engagement:
The diagram received positive feedback from viewers, who found it to be informative, visually appealing, and easy to understand. It sparked discussions and further inquiries about ABA principles.
Successful Integration of Design Elements:
The design elements, including the use of color, typography, and layout, were effectively employed to create a visually appealing and impactful diagram. The Psi symbol, representing psychology, was seamlessly integrated into the design, reinforcing the connection to the field of study.
Adaptability and Versatility:
The diagram's design allows for easy adaptation and modification for different purposes and audiences. It can be used in presentations, educational materials, and online resources.
Conclusion:
The creation of the ABA diagram was a successful endeavor, resulting in a valuable educational tool that effectively communicates the core principles of Applied Behavior Analysis. The diagram’s clear and concise visual representation, combined with its engaging design, contributed to enhanced understanding and improved communication of ABA concepts.
The positive feedback and engagement received by the diagram demonstrate its effectiveness as a learning and communication tool. The diagram’s adaptability and versatility further enhance its value, making it a valuable resource for educators, professionals, and individuals seeking to learn more about ABA.
Future Enhancements:
Important points to add in the future:
- Informative Annotations: Adding brief definitions or descriptions beside each characteristic would provide context and make the diagram more educational for viewers unfamiliar with ABA principles.
- Symbols with Text Labels: Adding universally recognized icons to memorize main Characteristics.
Summary of Findings:
Key Takeaways:
- Visual aids can significantly enhance the understanding of complex concepts.
- Clear and concise design is crucial for effective communication.
- Engaging visuals can increase audience interest and participation.
- Adaptability and versatility are essential for creating resources that can be used in various contexts.
The success of this case study highlights the importance of thoughtful design and visual communication in effectively conveying complex information and promoting understanding in the field of Applied Behavior Analysis.
References:
Some current dimensions of applied behavior analysis. J Appl Behav Anal. 1968 Spring;1(1):91-7. doi: 10.1901/jaba.1968.1-91. PMID: 16795165; PMCID: PMC1310980.
Pediatrics November 2007; 120 (5): 1162–1182. 10.1542/peds.2007-2362